Functions
There are three different kinds of functions:
Processing functions take an event and return a processed event (e.g.
RemoveBaseline), and they are meant to be used on event iterators:it = vai.MockData().get_event_iterator().with_processing(vai.RemoveBaseline())
Scalar functions take an event and return a scalar (e.g.
CalcMPreturns main parameters). They are meant to be applied to entire iterators using theapplyfunction:it = vai.MockData().get_event_iterator().with_processing(vai.RemoveBaseline()) pulse_height, onset, rise_time, decay_time, slope = vai.apply(vai.CalcMP(dt_us=it.dt_us), it)
Other functions don’t fall into those two categories (e.g.
applyor triggering functions).
Processing functions
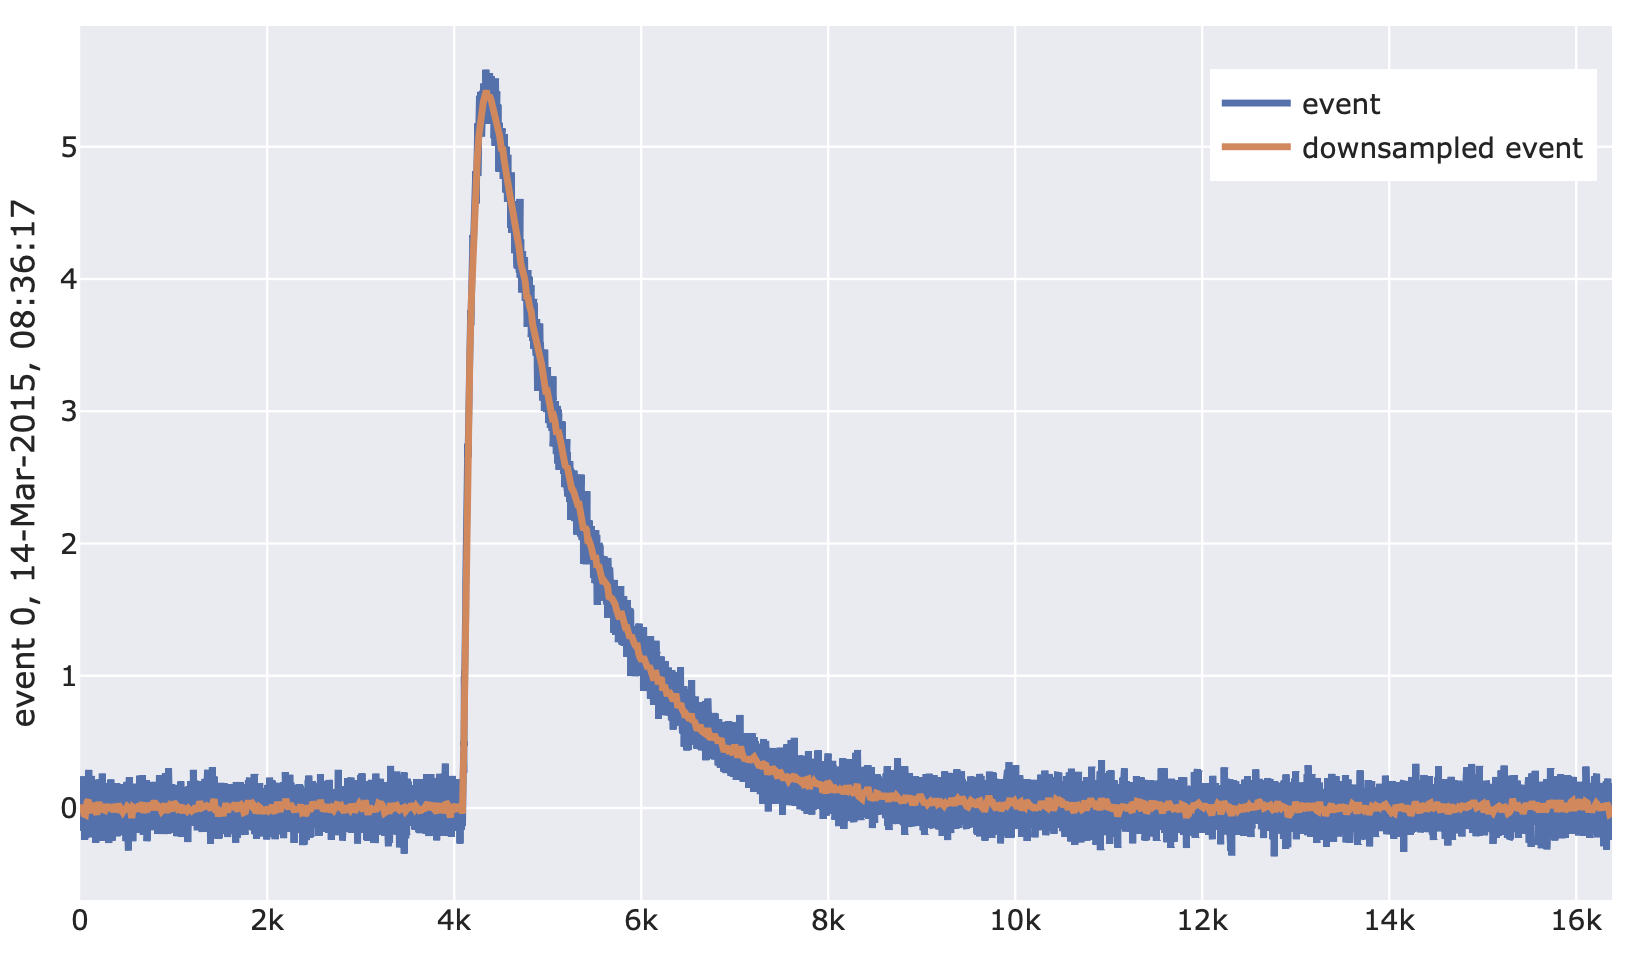
- class cait.versatile.Downsample(down: int = 2)[source]
Downsample an event by a given factor (which has to be a factor of the event’s length). Also works for multiple channels simultaneously.
- Parameters
down (int) – The factor by which to downsample the voltage trace.
- Returns
Downsampled event.
- Return type
np.ndarray
Example:
import cait.versatile as vai

# Construct mock data (which provides event iterator)
md = vai.MockData()
it = md.get_event_iterator()[0].with_processing(vai.RemoveBaseline())

# View effect of downsample on events
vai.Preview(it, vai.Downsample(16))
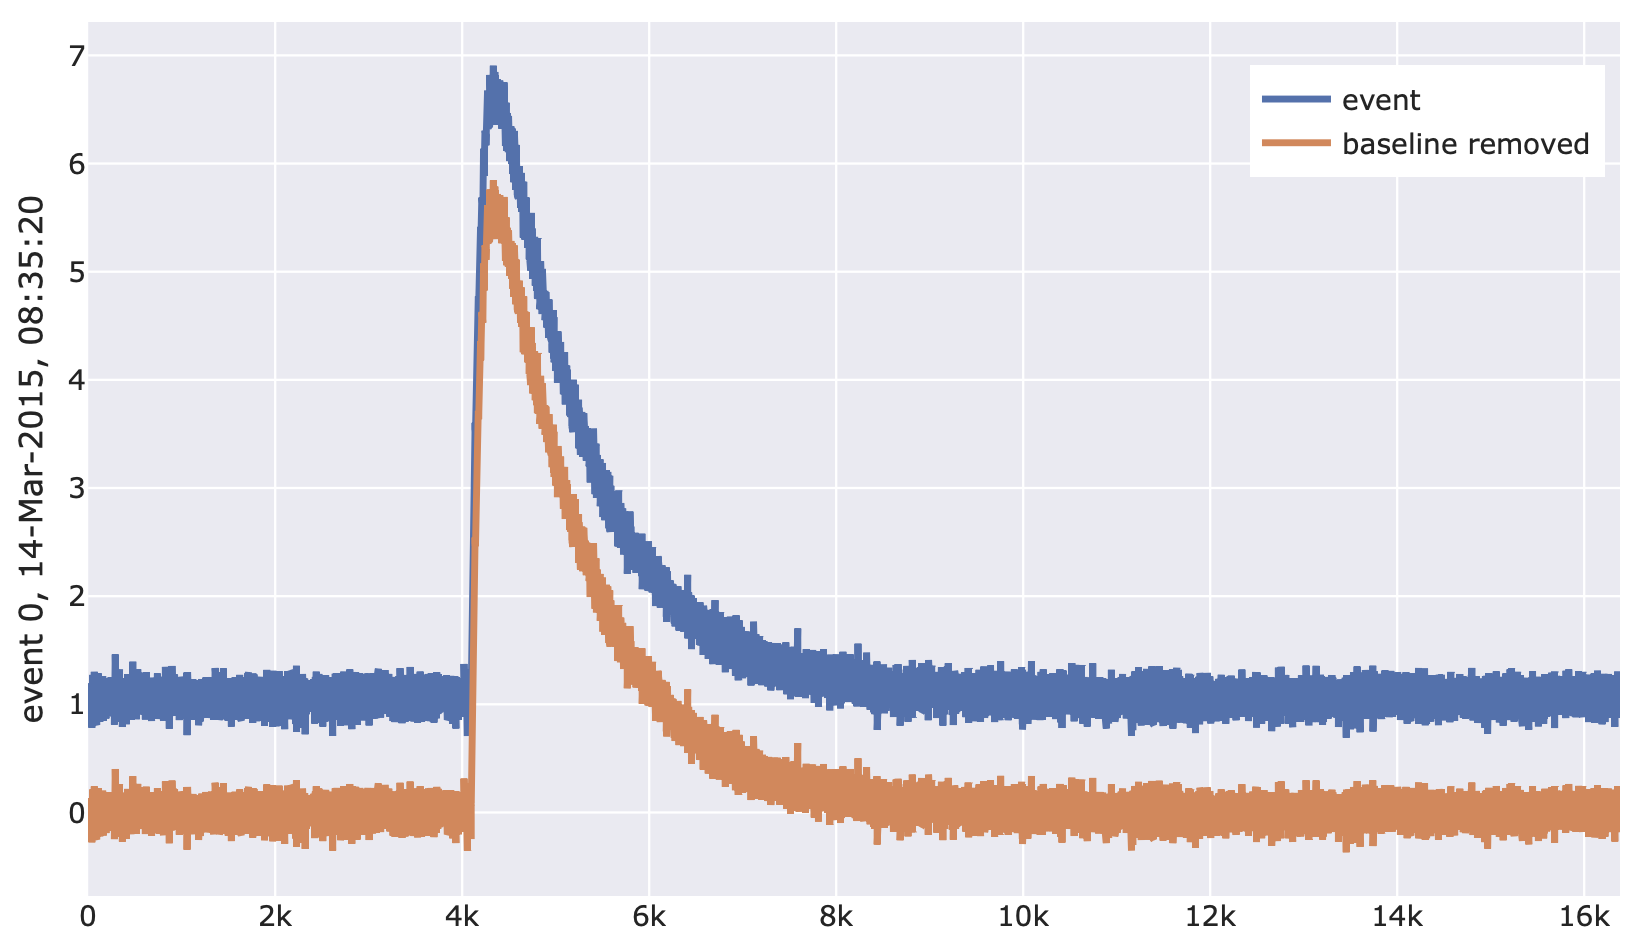
- class cait.versatile.RemoveBaseline(fit_baseline: dict = {'model': 0, 'where': 0.125, 'xdata': None})[source]
Remove baseline of given baseline model from an event voltage trace and return the new event. Also works for multiple channels simultaneously.
- Parameters
fit_baseline (dict) – Dictionary of keyword arguments that are passed on to
FitBaseline.- Returns
Event with baseline removed
- Return type
numpy.ndarray
Example:
import cait.versatile as vai

# Construct mock data (which provides event iterator)
md = vai.MockData()
it = md.get_event_iterator()[0]

# View effect of removing baseline on events
vai.Preview(it, vai.RemoveBaseline())
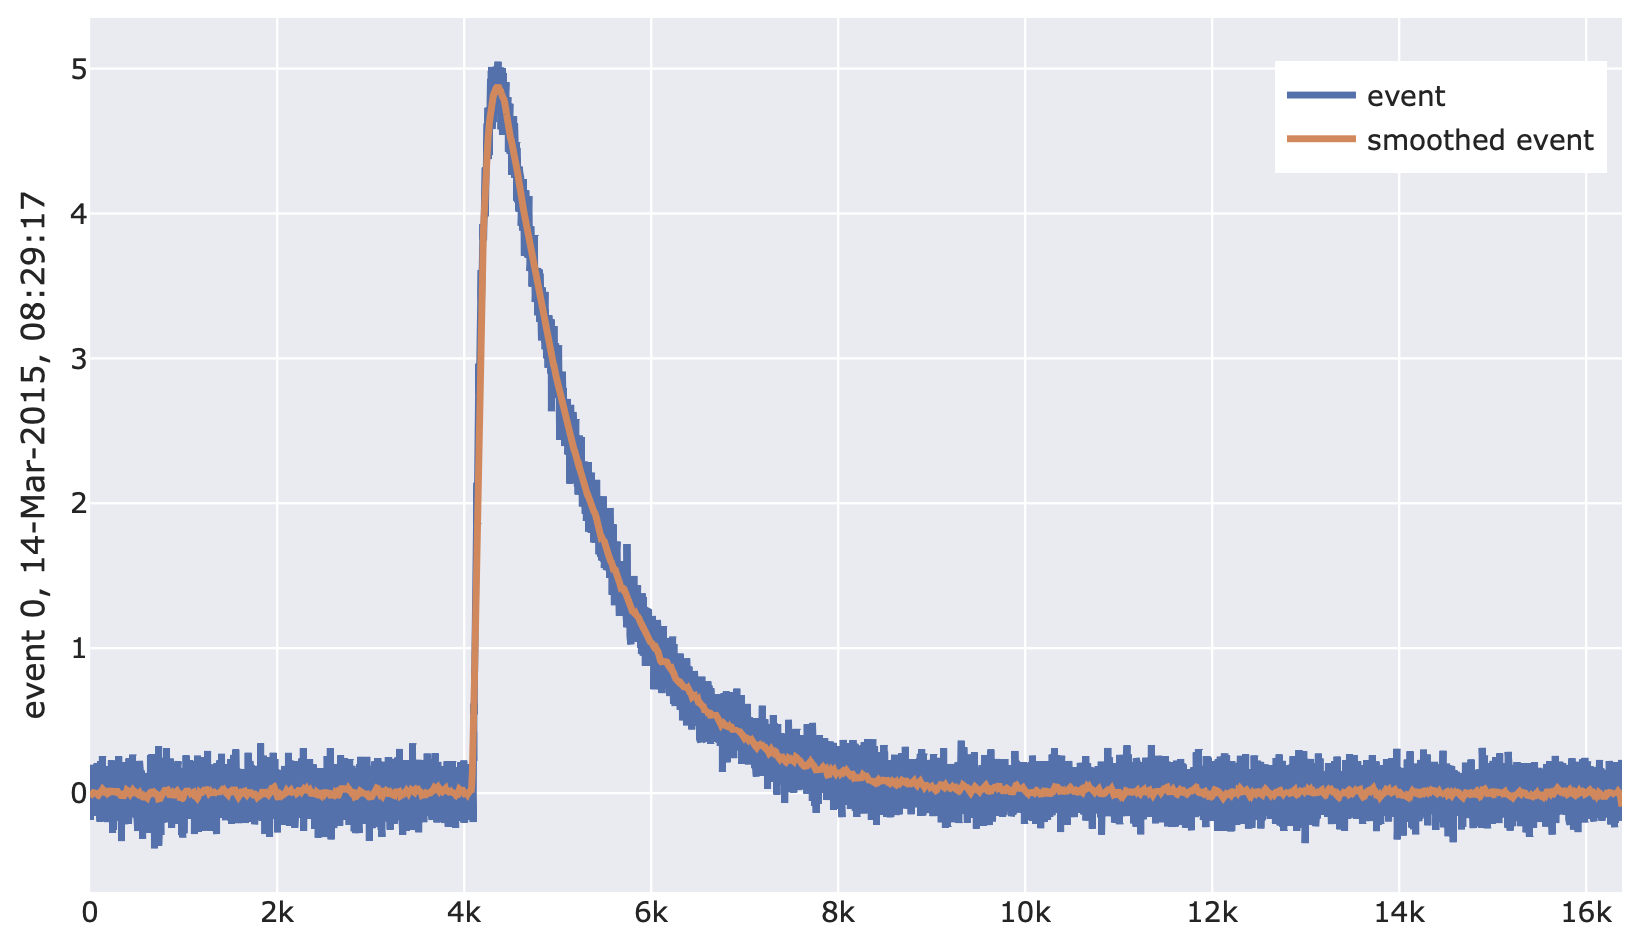
- class cait.versatile.BoxCarSmoothing(length: int = 50)[source]
Apply box-car-smoothing (moving average) to a voltage trace. Also works for multiple channels simultaneously.
- Parameters
length (int) – Length (in samples) of the moving average. Defaults to 50.
- Returns
Smoothed event.
- Return type
np.ndarray
Example:
import cait.versatile as vai

# Construct mock data (which provides event iterator)
md = vai.MockData()
it = md.get_event_iterator()[0].with_processing(vai.RemoveBaseline())

# View effect of moving average on events
vai.Preview(it, vai.BoxCarSmoothing())
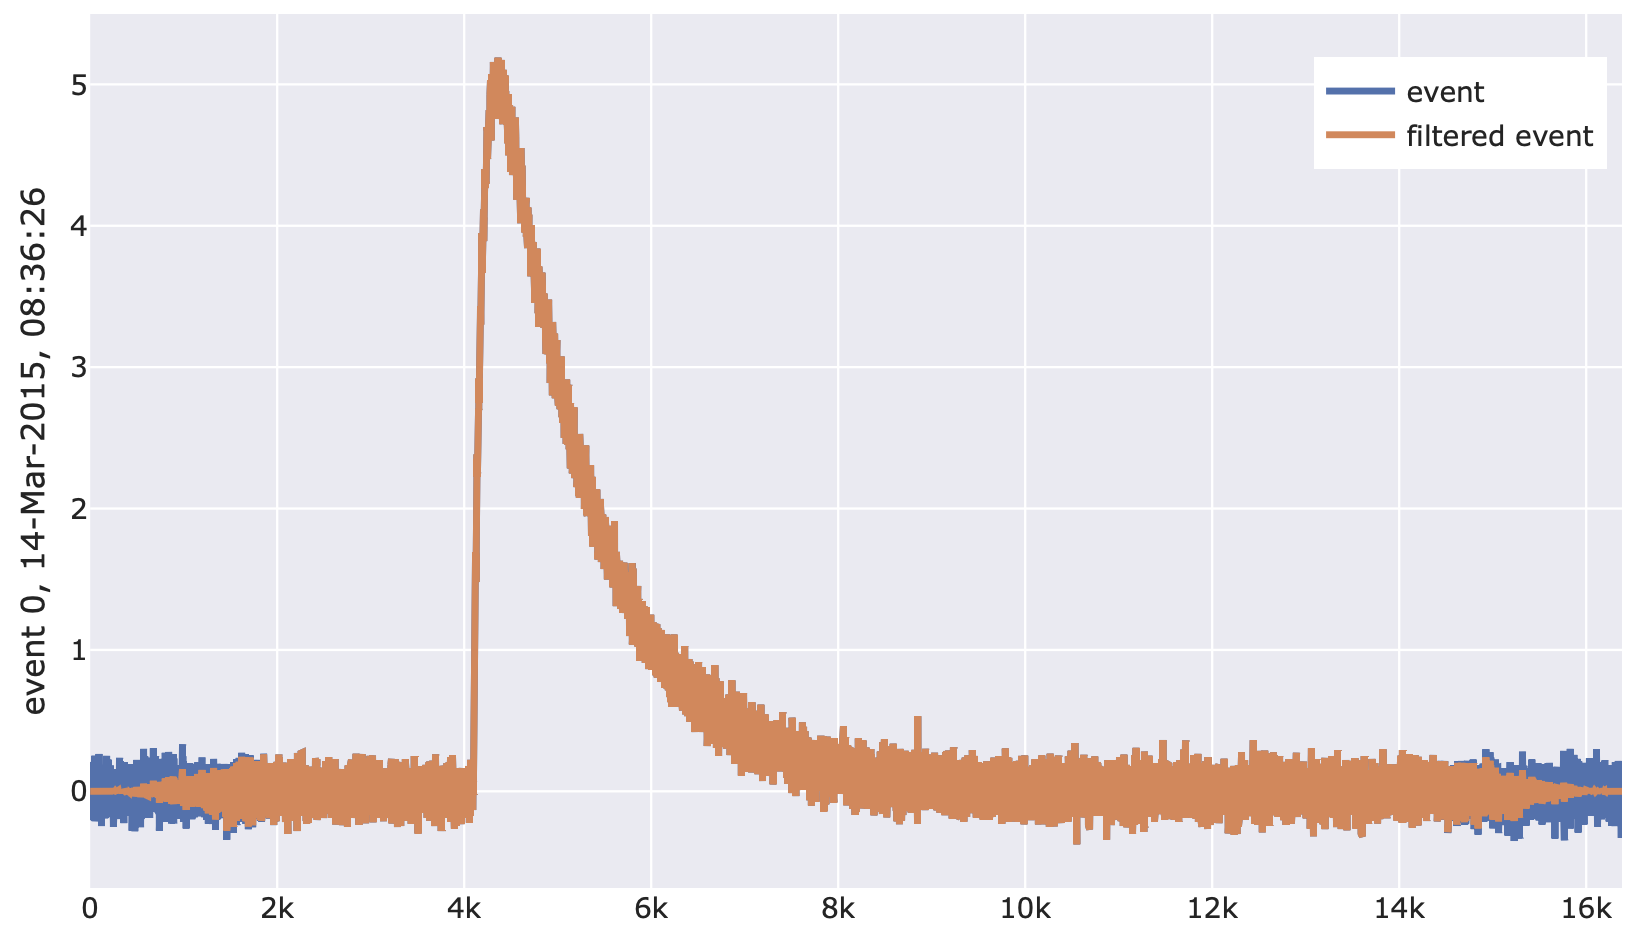
- class cait.versatile.TukeyFiltering(alpha: float = 0.25)[source]
Apply the Tukey window function to a voltage trace. Also works for multiple channels simultaneously.
- Parameters
alpha (float) – The parameter of the Tukey window function. Defaults to 0.25.
- Returns
Event with applied window function.
- Return type
np.ndarray
Example:
import cait.versatile as vai

# Construct mock data (which provides event iterator)
md = vai.MockData()
it = md.get_event_iterator()[0].with_processing(vai.RemoveBaseline())

# View effect of filtering on events
vai.Preview(it, vai.TukeyFiltering())
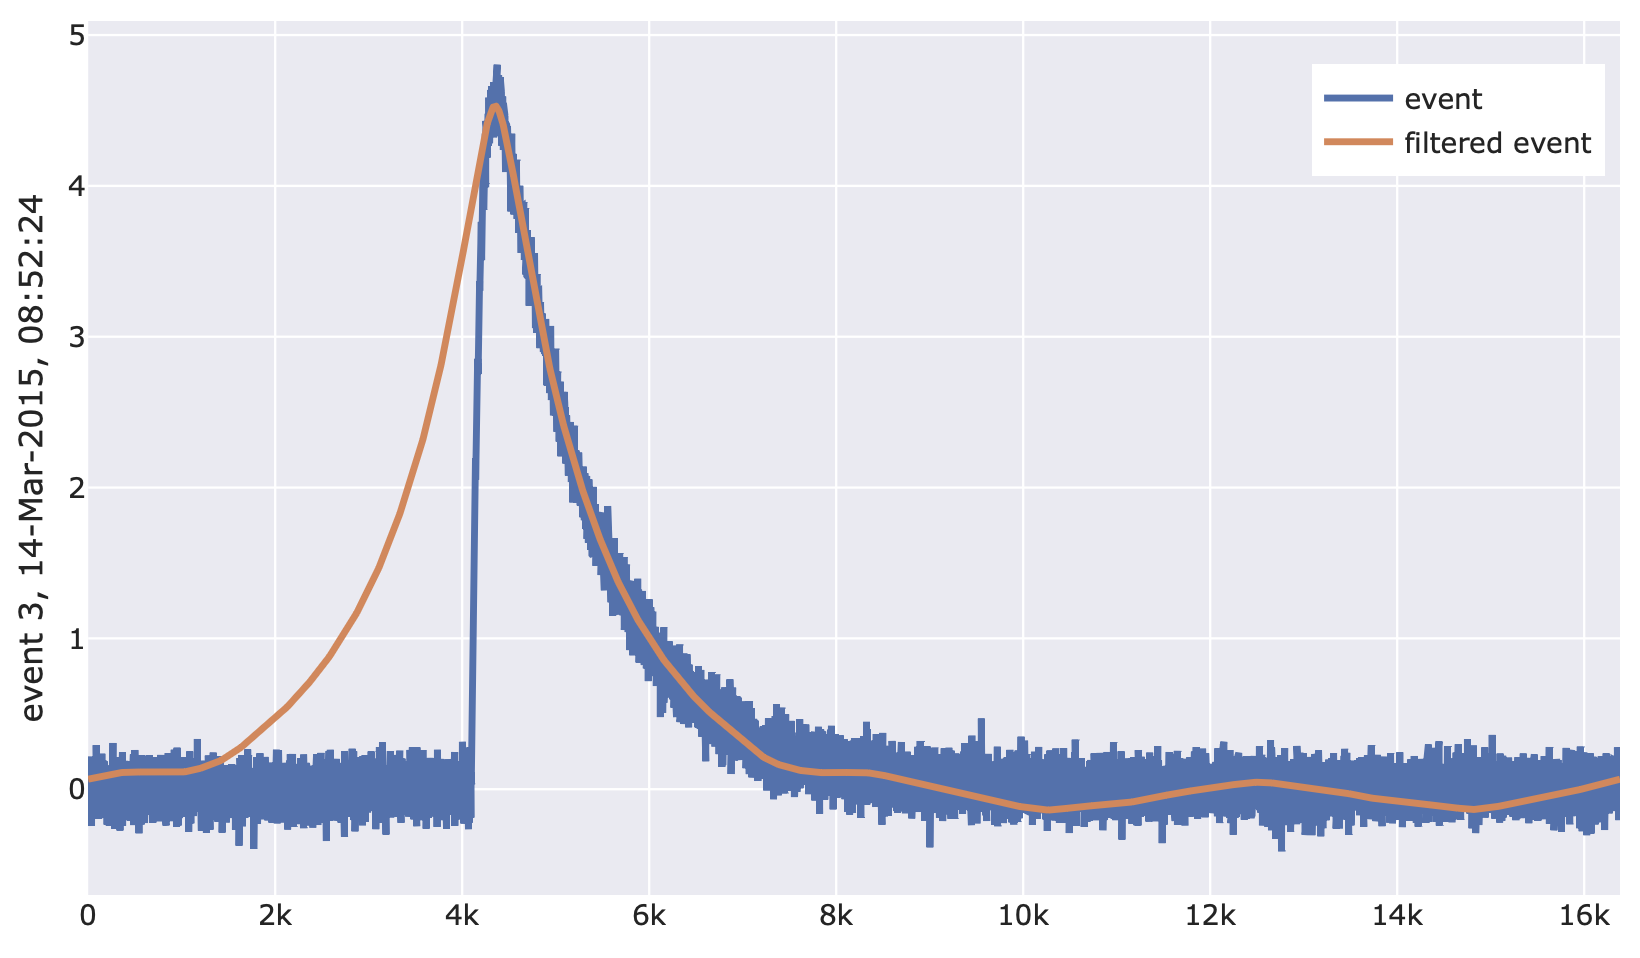
- class cait.versatile.OptimumFiltering(of)[source]
Apply an optimum filter to a voltage trace. Works for multiple channels simultaneously if optimum filter is also given for multiple channels.
- Parameters
of (np.ndarray) – The optimum filter to use.
- Returns
Filtered event.
- Return type
np.ndarray
Example:
import cait.versatile as vai

# Construct mock data (which provides event iterator and optimum filter)
md = vai.MockData()
it = md.get_event_iterator()[0].with_processing(vai.RemoveBaseline())
of = md.of[0]

# View effect of filtering on events
vai.Preview(it, vai.OptimumFiltering(of))
Scalar functions
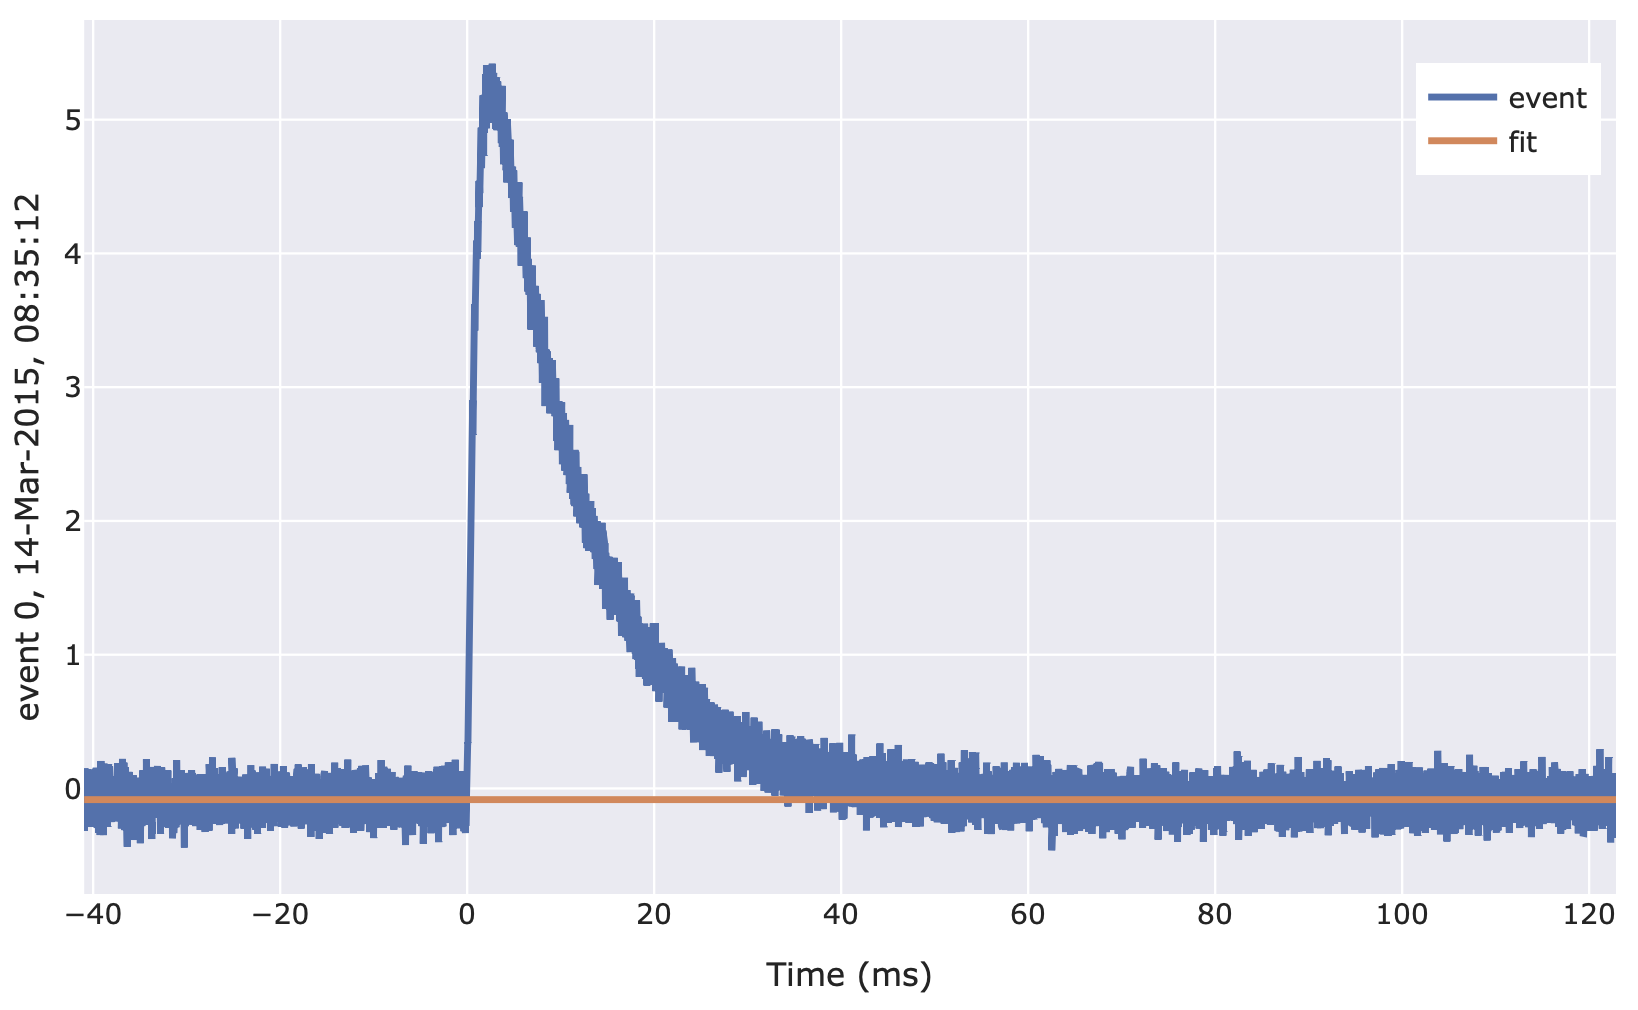
- class cait.versatile.FitBaseline(model: Union[int, str] = 0, where: Union[List[bool], slice, float] = slice(None, None, None), xdata: Optional[List[float]] = None)[source]
Fit voltage traces with a polynomial or decaying exponential and return the fit parameters as well as the RMS. Also works for multiple channels simultaneously.
- Parameters
model (Union[int, str]) – Order of the polynomial or ‘exponential’/’exp’, defaults to 0, i.e. a constant baseline.
where (Union[List[bool], slice, int]) – Specifies a subset of data points to be used in the fit: Either a boolean flag of the same length of the voltage traces, a slice object (e.g. slice(0,50) for using the first 50 data points), or a float. If a float where is passed, the first int(where)*record_length samples are used (e.g. if where=1/8, the first 1/8th of the record window is used). Defaults to `slice(None, None, None).
xdata (List[float]) – x-data to use for the fit (has no effect for order=0). Specifying xdata is not necessary in general but if you want your fit parameters to have physical units (e.g. time constants) instead of just samples, you may use this option. Defaults to None, in which case xdata=np.linspace(0,1,record_length).
- Returns
Fit parameter(s) and RMS as a tuple.
- Return type
Tuple[Union[float, numpy.ndarray], float]
Example:
import cait.versatile as vai

# Construct mock data (which provides event iterator)
md = vai.MockData()
it = md.get_event_iterator()[0]

# View effect of fitting baseline on events
# We specify that for the fit, 1/8th of the record window should be used,
# that we fit with a degree-0-polynomial (i.e. constant)
# Specifying the xdata is not necessary, but it lets us plot in terms of time
vai.Preview(it, vai.FitBaseline(where=1/8, model=0, xdata=it.t), xlabel="Time (ms)")
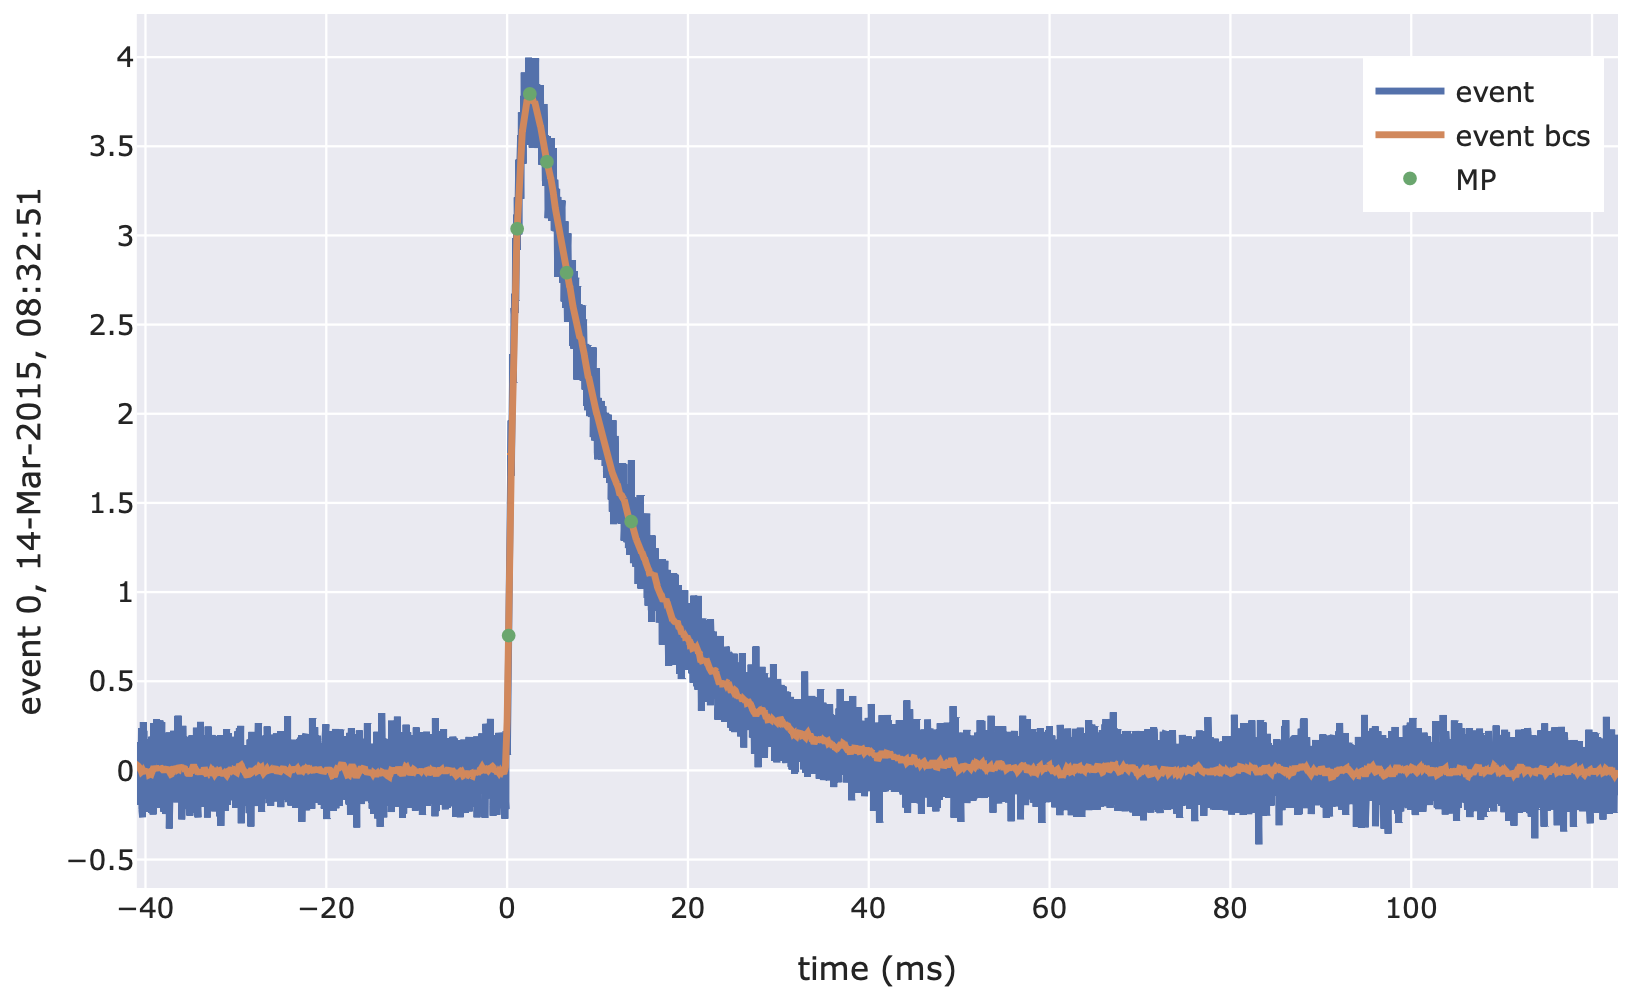
- class cait.versatile.CalcMP(dt_us: Optional[int] = None, peak_bounds: tuple = (0.2, 0.4), edge_size: float = 0.125, box_car_smoothing: dict = {'length': 50}, fit_baseline: dict = {'model': 0, 'where': 0.125, 'xdata': None})[source]
Calculates main parameters for an event. If the argument
dTis set toNone, the output is an array of shape(n_channels, 9), where the nine entries areph, t_0, t_rise, t_max, t_decaystart, t_half, t_end, offset, lin_drift, and quantities starting witht_are given as sample indices. If the argumentdTis set (to the microsecond time base of the recording), the (human readable) quantitiespulse_height (V), onset (ms), rise_time (ms), decay_time (ms), slope (V)as a tuple. Also works for multiple channels simultaneously.- Parameters
dt_us (int, optional) – The microsecond time base of the recording. If not provided, physical time constants cannot be computed and the function outputs indices. See above.
peak_bounds (tuple, optional) – The region in the record window which is considered for peak search. A tuple
(0,1)searches the entire window,(0,1/2)only searches the first half, etc. Defaults to(1/5, 2/5).edge_size (float, optional) – The (relative) size of the record window that is used to compute the linear drift. Defaults to 1/8, meaning that the first and last 1/8th of the record window is used.
box_car_smoothing (dict, optional) – Arguments for class:BoxCarSmoothing, which are used for the application of the moving average. Defaults to
{'length': 50}.fit_baseline (dict, optional) – Arguments for class:FitBaseline, which are used for the baseline subtractions. Defaults to
{'model': 0, 'where': 1/8, 'xdata': None}.
- Returns
Either an array or tuple. See above.
- Return type
np.ndarray, tuple
Example:
import cait.versatile as vai

# Get events from mock data (and remove baseline)
it = vai.MockData().get_event_iterator().with_processing(vai.RemoveBaseline())

# Without the 'dt_us' keyword (output is numpy array)
mp_array = vai.apply(vai.CalcMP(), it)

# WITH the 'dt_us' keyword (output is tuple with physical values)
pulse_height, onset, rise_time, decay_time, slope = vai.apply(vai.CalcMP(dt_us=it.dt_us), it)

# Example for plotting a histogram of the pulse hights of both channels
vai.Histogram({'ch0': pulse_height[:,0], 'ch1': pulse_height[:,1]})
Example Preview:
import cait.versatile as vai

# Get events from mock data (and remove baseline)
it = vai.MockData().get_event_iterator().with_processing(vai.RemoveBaseline())[0]

# View main parameter calculation in action. The plot shows the original
# event, the event after the moving average, and the selected datapoints
# for calculating the main parameters.
vai.Preview(it, vai.CalcMP())
Other functions
- cait.versatile.apply(f: Callable, ev_iter: cait.versatile.iterators.iteratorbase.IteratorBaseClass, n_processes: int = 1)[source]
Apply a function to events provided by an EventIterator.
Multiprocessing and resolving batches as returned by the iterator is done automatically. The function returns a numpy array where the first dimension corresponds to the events returned by the iterator. Higher dimensions are as returned by the function that is applied. Batches are resolved, i.e. calls with an EventIterator(…, batch_size=1) and EventIterator(…, batch_size=100) yield identical results.
Important: Since apply uses multiprocessing, it is best not to use functions that are defined locally within jupyter lab, but rather to define them in a separate .py file and load them from the notebook. This is only relevant if you are trying to define your own function and not if you are just using already existing cait functions.
- Parameters
f (Callable) – Function to be applied to events. Note the restriction above.
ev_iter (~class:cait.versatile.file.EventIterator) – Events for which the function should be applied.
n_processes (int) – Number of processes to use for multiprocessing.
- Returns
Results of f for all events in ev_iter. Has same structure as output of f (just with an additional event dimension).
- Return type
Any
Example:
import cait.versatile as vai
import numpy as np

def func1(event): return np.max(event)
def func2(event): return np.min(event), np.max(event)

# Example when func has one output
it = vai.MockData().get_event_iterator(batch_size=42)
out = vai.apply(func1, it)

# Example when func has two outputs
it = vai.MockData().get_event_iterator(batch_size=42)
out1, out2 = vai.apply(func2, it)
- cait.versatile.trigger_of(stream, key: str, threshold: float, of: numpy.ndarray, n_triggers: Optional[int] = None, chunk_size: int = 100, apply_first: Optional[Union[callable, List[callable]]] = None)[source]
Trigger a single channel of a stream object using the optimum filter triggering algorithm described in https://edoc.ub.uni-muenchen.de/23762/.
- Parameters
stream (StreamBaseClass) – The stream object with the channel to trigger.
key (str) – The name of the channel in ‘stream’ to trigger.
threshold (float) – The threshold (in Volts) above which events should be triggered.
of (np.ndarray) – The optimum filter to be used for filtering (it is assumed that the filter’s first entry is set to zero to correctly remove the offset).
n_triggers (int) – The number of events to trigger (might be more, depending on ‘chunk_size’). E.g. useful to look at the first 100 triggered events. Defaults to None, i.e. all events in the stream are triggered
chunk_size (int) – The number of record windows that are processed (i.e. filter + peak search) at a time.
apply_first (Union[callable, List[callable]], optional) – A function or list of functions to be applied to the stream data BEFORE the filter function is applied. E.g.
lambda x: -xto trigger on the inverted stream.
- Returns
Tuple of trigger indices and trigger heights.
- Return type
Tuple[List[int], List[float]]
Example:
import cait.versatile as vai

# Construct stream object
stream = vai.Stream(hardware="vdaq2", src="path/to/stream_file.bin")
# Get an optimum filter from somewhere (here, we get one from mock data but
# this will not work for your stream data)
of = vai.MockData().of

# Perform triggering
trigger_inds, amplitudes = vai.trigger_of(stream, "ADC1", 0.1, of)
# Get trigger timestamps from trigger indices
timestamps = stream.time[trigger_inds]
# Plot trigger amplitude spectrum
vai.Histogram(amplitudes)
- cait.versatile.trigger_zscore(stream, key: str, record_length: int, threshold: float = 5, n_triggers: Optional[int] = None, chunk_size: int = 100, apply_first: Optional[Union[callable, List[callable]]] = None)[source]
Trigger a single channel of a stream object using a moving z-score.
- Parameters
stream (StreamBaseClass) – The stream object with the channel to trigger.
key (str) – The name of the channel in ‘stream’ to trigger.
threshold (float) – The threshold (in z-scores) above which events should be triggered.
n_triggers (int) – The number of events to trigger (might be more, depending on ‘chunk_size’). E.g. useful to look at the first 100 triggered events. Defaults to None, i.e. all events in the stream are triggered
chunk_size (int) – The number of record windows that are processed (i.e. z-score calculation + peak search) at a time.
apply_first (Union[callable, List[callable]], optional) – A function or list of functions to be applied to the stream data BEFORE the filter function is applied. E.g.
lambda x: -xto trigger on the inverted stream.
- Returns
Tuple of trigger indices and trigger heights.
- Return type
Tuple[List[int], List[float]]
Example:
import cait.versatile as vai

# Construct stream object
stream = vai.Stream(hardware="vdaq2", src="path/to/stream_file.bin")
# Perform triggering
trigger_inds, amplitudes = vai.trigger_of(stream, "ADC1", 2**14)
# Get trigger timestamps from trigger indices
timestamps = stream.time[trigger_inds]
# Plot trigger amplitude spectrum
vai.Histogram(amplitudes)