cait.fit
-
cait.fit.baseline_template_cubic(t, c0, c1, c2, c3)[source]¶ Template for the baseline fit, with constant linear, quadratic and cubic component.
- Parameters
t (1D array) – The time grid.
c0 (float) – Constant component.
c1 (float) – Linear component.
c2 (float) – Quadratic component.
c3 (float) – Cubic component.
- Returns
The cubic polynomial evaluated on the time grid.
- Return type
1D array
-
cait.fit.baseline_template_quad(t, c0, c1, c2)[source]¶ Template for the baseline fit, with constant linear and quadratic component.
- Parameters
t (1D array) – The time grid.
c0 (float) – Constant component.
c1 (float) – Linear component.
c2 (float) – Quadratic component.
- Returns
The parabola evaluated on the time grid.
- Return type
1D array
-
cait.fit.fit_pulse_shape(event, x0=None, sample_length=0.04, down=1, t0_start=- 3, t0_bounds=(- 10, 5), opt_start=False)[source]¶ Fits the pulse shape model to a given event and returns the fit parameters.
- Parameters
event (1D array) – The event to fit.
x0 (None or 1D array) – The start values for the fit: (t0, An, At, tau_n, tau_in, tau_t).
sample_length (float) – The length of one sample in milliseconds.
down (int) – Should be power of 2, downsample rate during the fit.
t0_start (float) – The start value for t0.
t0_bounds (tuple) – Lower and upper bound for the t0 value.
opt_start (bool) – If activated the start values are searched with a differential evolution algorithm.
- Returns
The fitted parameters.
- Return type
1D array length 6
-
cait.fit.fit_quadratic_baseline(event)[source]¶ Fits a quadratic baseline template the to given event
- Parameters
event – 1D array, the event to fit the baseline template
- Returns
list of 3 floats (offset, linear_drift, quadratic_drift)
-
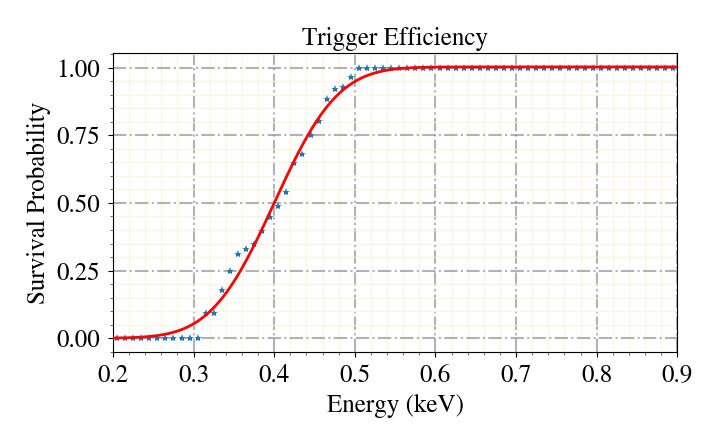
cait.fit.fit_trigger_efficiency(binned_energies, survived_fraction, a1_0, a0_0=1, a2_0=0.01, plot=False, title=None, xlim=None)[source]¶ Fit and plot the trigger efficiency.
- Parameters
binned_energies (list of length nmbr_bins + 1) – The bin edges, in keV.
survived_fraction (list) – The number of survived events per bin, in keV.
a0_0 (float) – Start Value for estimated constant survival probability above threshold.
a1_0 (float) – Start Value for estimated threshold value, in keV.
a2_0 (float) – Start Value for estimator for the energy resolution, in keV.
plot (bool) – Plot the fitted function.
title (str) – The title for the plot.
xlim (tuple) – The x limits for the plot.
- Returns
The fitted values a0, a1, a2.
- Return type
list
>>> import cait as ai
>>> import numpy as np
>>> # create mock data
>>> X = np.random.uniform(low=0, high=1, size=10000)
>>> randoms = np.random.uniform(low=0.3, high=0.5, size=10000)
>>> surviving = np.empty(10000, dtype=bool)
>>> surviving[X < 0.3] = False
>>> surviving[X > 0.5] = True
>>> inbet = np.logical_and(X > 0.3, X < 0.5)
>>> surviving[inbet] = X[inbet] > randoms[inbet]
>>> hist, bins = np.histogram(X[surviving], bins=100, range=(0, 1))
>>> hist_all, _ = np.histogram(X, bins=100, range=(0, 1))
>>> # do the fit
>>> a0, a1, a2 = ai.fit.fit_trigger_efficiency(binned_energies=bins,
...                                            survived_fraction=hist/hist_all,
...                                            a1_0=0.4,
...                                            a0_0=0.9,
...                                            a2_0=0.1,
...                                            plot=True,
...                                            title='Trigger Efficiency',
...                                            xlim=(0.2, 0.9))
Estimated constant survival probability:  1.0029709355728647
Estimated energy threshold (keV):  0.4002443060404336
Estimated energy resolution (keV):  0.06203246371547854
-
cait.fit.generate_standard_event(events, main_parameters, labels=None, correct_label=1, pulse_height_interval=None, left_right_cutoff=None, rise_time_interval=None, decay_time_interval=None, onset_interval=None, remove_offset=True, verb=False, scale_fit_height=True, scale_to_unit=True, sample_length=0.04, t0_start=None, opt_start=False)[source]¶ Calculates the standard event and fits the pulse shape model.
- Parameters
events (2D array of shape (nmbr_events, record_length)) – The events to calculate the SEV from.
main_parameters (2D array of shape (nmbr_events, nmbr_mp=10)) – The main parameters of the events.
labels (None or 1D array of shape (nmbr_events)) – The labels of the events, if set only the correct labels are included in the SEV generation.
correct_label (int) – The correct label to calc SEV from, 1==events, 2==testpulses.
pulse_height_interval (None or 2-tuple or list) – The interval in which the PH may be to be included.
left_right_cutoff (None or float) – The maximal abs(R - L) baseline difference of the event.
rise_time_interval (None or 2-tuple or list) – The interval in ms in which the rise time may be to be included.
decay_time_interval (None or 2-tuple or list) – The interval in ms in which the decay time may be to be included.
onset_interval (None or 2-tuple or list) – The interval in which the onset time in ms may be to be included.
remove_offset (bool) – If True the offset of the events is removed before building mean for SEV; highly recommended!
verb (bool) – If True verbal feedback about the progress of the program is provided.
scale_fit_height (bool) – If True the fitpar of the sev are scaled to height 1 after the fit.
sample_length (float) – The length of one sample in milliseconds –> needed for the fit!
t0_start (float) – The start value for t0.
opt_start (bool) – If activated the starting values are searched with a differential evolution algorithm.
- Returns
The calculated sev, the fit parameters.
- Return type
tuple of two 1D arrays with shape (record_length, nmbr_fitpar)
-
cait.fit.get_noise_parameters_binned(counts, bins)[source]¶ Return the least squares fit parameters to the purely Gaussian noise model. You need to calculate a histogram of the maxima of the empty baselines before already, e.g. with np.hist.
- Parameters
counts (1D array) – The counts within the bins.
bins (1D array) – The bin edges. This array is one number longer than the counts array.
- Returns
The fitted parameters (d, sigma).
- Return type
2-tuple
-
cait.fit.get_noise_parameters_unbinned(events, model='gauss', sigma_x0=2)[source]¶ Find the maximum likelihood estimators of all noise trigger model parameters in an unbinned maximum likelihood fit.
- Parameters
events (1D array) – The array of the unbinned noise baseline maxima.
model (string) – The model that is used to fit the noise maxima. - ‘gauss’: Purely Gaussian noise model. - ‘pollution_exponential’: Gaussian noise model with an exponentially distributed pollution. - ‘fraction_exponential’: Gaussian-exponential mixture noise model. - ‘pollution_gauss’: Gaussian noise model with an Gaussian distributed pollution. - ‘fraction_gauss’: Gaussian mixture noise model.
sigma_x0 (float) – The start value for the baseline resolution.
- Returns
The fitted parameters. These are different for each model and compatible with the functions gauss_noise, pollution_exponential_noise, fraction_exponential_noise and pollution_gauss_noise.
- Return type
1D array
-
cait.fit.logistic_curve(x, A, K, C, Q, B, nu)[source]¶ Returns the evaluated logistics curve at x.
- Parameters
x (scalar or 1D numpy array) – The x value or grid.
A (float) – A parameter of the generalized logistics curve.
K (float) – A parameter of the generalized logistics curve.
C (float) – A parameter of the generalized logistics curve.
Q (float) – A parameter of the generalized logistics curve.
B (float) – A parameter of the generalized logistics curve.
nu (float) – A parameter of the generalized logistics curve.
- Returns
The evaluated log curve at x.
- Return type
scalar or 1D numpy array
-
cait.fit.pulse_template(t, t0, An, At, tau_n, tau_in, tau_t)[source]¶ Parametric model for the pulse shape, 6 parameters.
This method was described in “(1995) F. Pröbst et. al., Model for cryogenic particle detectors with superconducting phase transition thermometers.”
- Parameters
t – 1D array, the time grid; attention, this needs to be provided in compatible units with the fit parameters!
t0 (float) – The pulse onset time.
An (float) – Amplitude of the first nonthermal pulse component.
At (float) – Amplitude of the thermal pulse component.
tau_n (float) – Parameter for decay 1. comp and rise 2. comp.
tau_in (float) – Parameter for rise 1. comp.
tau_t (float) – Parameter for decay 2. comp.
- Returns
The pulse model evaluated on the time grid.
- Return type
1D array
-
class
cait.fit.sev_fit_template(pm_par, t, down=1, t0_bounds=(- 20, 20), truncation_level=None, interval_restriction_factor=None, saturation_pars=None)[source]¶ Bases:
objectClass to store pulse fit models for individual detectors.
This method was described in “F. Reindl, Exploring Light Dark Matter With CRESST-II Low-Threshold Detector”, available via http://mediatum.ub.tum.de/?id=1294132 (accessed on the 9.7.2021).
- Parameters
par (1D array with size 6) – 1D array with size 6, the fit parameter of the sev (t0, An, At, tau_n, tau_in, tau_t).
t (1D array) – The time grid on which the pulse shape model is evaluated.
down (int) – Power of 2, the downsample rate of the event for fitting.
t0_bounds (tuple) – The lower and upper bounds for the t0 value.
truncation_level (float) – All values above this are excluded from the fit.
interval_restriction_factor (float) – Value between 0 and 1, the inverval of the event is restricted around 1/4 by this factor.
saturation_pars – The fit parameter of the saturation curve (A, K, C, Q, B, nu).
- Rtype saturation_pars
1D array with size 6
-
fit_cubic(pars)[source]¶ Calculates the standard event fit parameters with a cubic baseline model.
- Parameters
pars (list of (1D array, float, float)) – The event to fit, the fixed onset value, a start value for the onset.
- Returns
The sev fit parameters.
- Return type
1D array of length 6
-
sef(h, t0, a0)[source]¶ Standard Event Model with Flat Baseline.
- Parameters
h (float) – Height of pulse shape.
t0 (float) – Onset of pulse shape.
a0 (float) – Offset of the baseline.
- Returns
The pulse model evaluated on the time grid.
- Return type
1D array
-
sel(h, t0, a0, a1)[source]¶ Standard Event Model with Linear Baseline.
- Parameters
h (float) – Height of pulse shape.
t0 (float) – Onset of pulse shape.
a0 (float) – Offset of the baseline.
a1 (float) – Linear drift component of the baseline.
- Returns
The pulse model evaluated on the time grid.
- Return type
1D array
-
seq(h, t0, a0, a1, a2)[source]¶ Standard Event Model with Quadradtic Baseline.
- Parameters
h (float) – Height of pulse shape.
t0 (float) – Onset of pulse shape.
a0 (float) – Offset of the baseline.
a1 (float) – Linear drift component of the baseline.
a2 (float) – Quadratic drift component of the baseline.
- Returns
The pulse model evaluated on the time grid.
- Return type
1D array
-
cait.fit.threshold_model(x, a0, a1, a2)[source]¶ Fit model for the threshold
- Parameters
x (array) – The grid on which the model is evaluated.
a0 (float) – Estimated constant survival probability above threshold.
a1 (float) – Estimated threshold value.
a2 (float) – Estimator for the energy resolution.
- Returns
The evaluated error function
- Return type
array