cait.versatile - the flexible cait
While cait provides excellent methods for raw data analysis, it is a very rigid framework mostly developed with the needs of the CRESST experiment in mind, and if one needs anything out of the ordinary, individualizing the workflow can be cumbersome. The sub-package cait.versatile aims to streamline this process and provide clear entry points to the existing framework. Moreover, it introduces convenience features for as-fast-as-possible data quality assessment.
On the other hand, cait.versatile can be seen as a ‘tool kit’ of ‘building blocks’ that can (should) be used for function prototyping and eventually also implementing new cait core features as efficiently as possible.
The philosophy of cait.versatile rests upon the following building blocks:
- data sources (docs)
Objects that make interfacing the various sources of data as easy as possible. Examples are
RDTFilefor interfacing hardware triggered data files,Streamto access data from a continuous stream file (where it is irrelevant which hardware was used to record the data), but also the object that should be most familiar tocaitusers, theDataHandleris a data source. Data sources do not have to be files but can also provide simulated data on the fly, likeMockDatawhich returns mock voltage traces for quickly testing functions.The crucial thing is that the technical details on how to access the data behind a data source are hidden from the user. The objects of most interest are voltage traces (“events”) and data sources make it easy to access those voltage traces, no matter how they are stored. A data source provides event iterators.
Example:
f = vai.RDTFile("path/to/file.rdt") # construct RDT object
channels = f[(26,27)]               # choose channels in file
it = channels.get_event_iterator()  # get event iterator
- event iterators (docs)
Objects that represent voltage traces. They are provided by data sources and are returned on-demand, meaning that it is memory efficient. Event iterators also have properties which tell you how they were recorded. E.g.,
dt_us(the time base in microseconds),record_length(the record length in samples),timestamps(the microsecond timestamps of the events).Event iterators can be sliced (choose a single channel from a multi channel iterator, or choose a subset of events in the iterator using indices or a boolean flag), added (stick together the events of multiple
Streamand process them in one go, for example) and you can apply functions to them.Upon constructing an iterator from a data source, you can also specify a
batch_size. If it is greater than one, multiple events are read from the data source and returned at once. This reduces the number of file accesses which might speed up your analysis.You can tell iterators to apply a processing function on its events before it returns them. Processing functions are discussed below.
Example:
it = vai.MockData().get_event_iterator() # quick way to get iterator of two-channel-events for testing
it_firstch = it[0]                       # new iterator with first channel only
it_first10 = it[:,:10]                   # new iterator with only first 10 events (all channels)

# chain event iterators
it2 = vai.MockData().get_event_iterator()
combined_it = it + it2

# Add baseline removal to the iterator. Every time the iterator returns
# an event, it will have its baseline removed.
without_bl = it.with_processing(vai.RemoveBaseline())

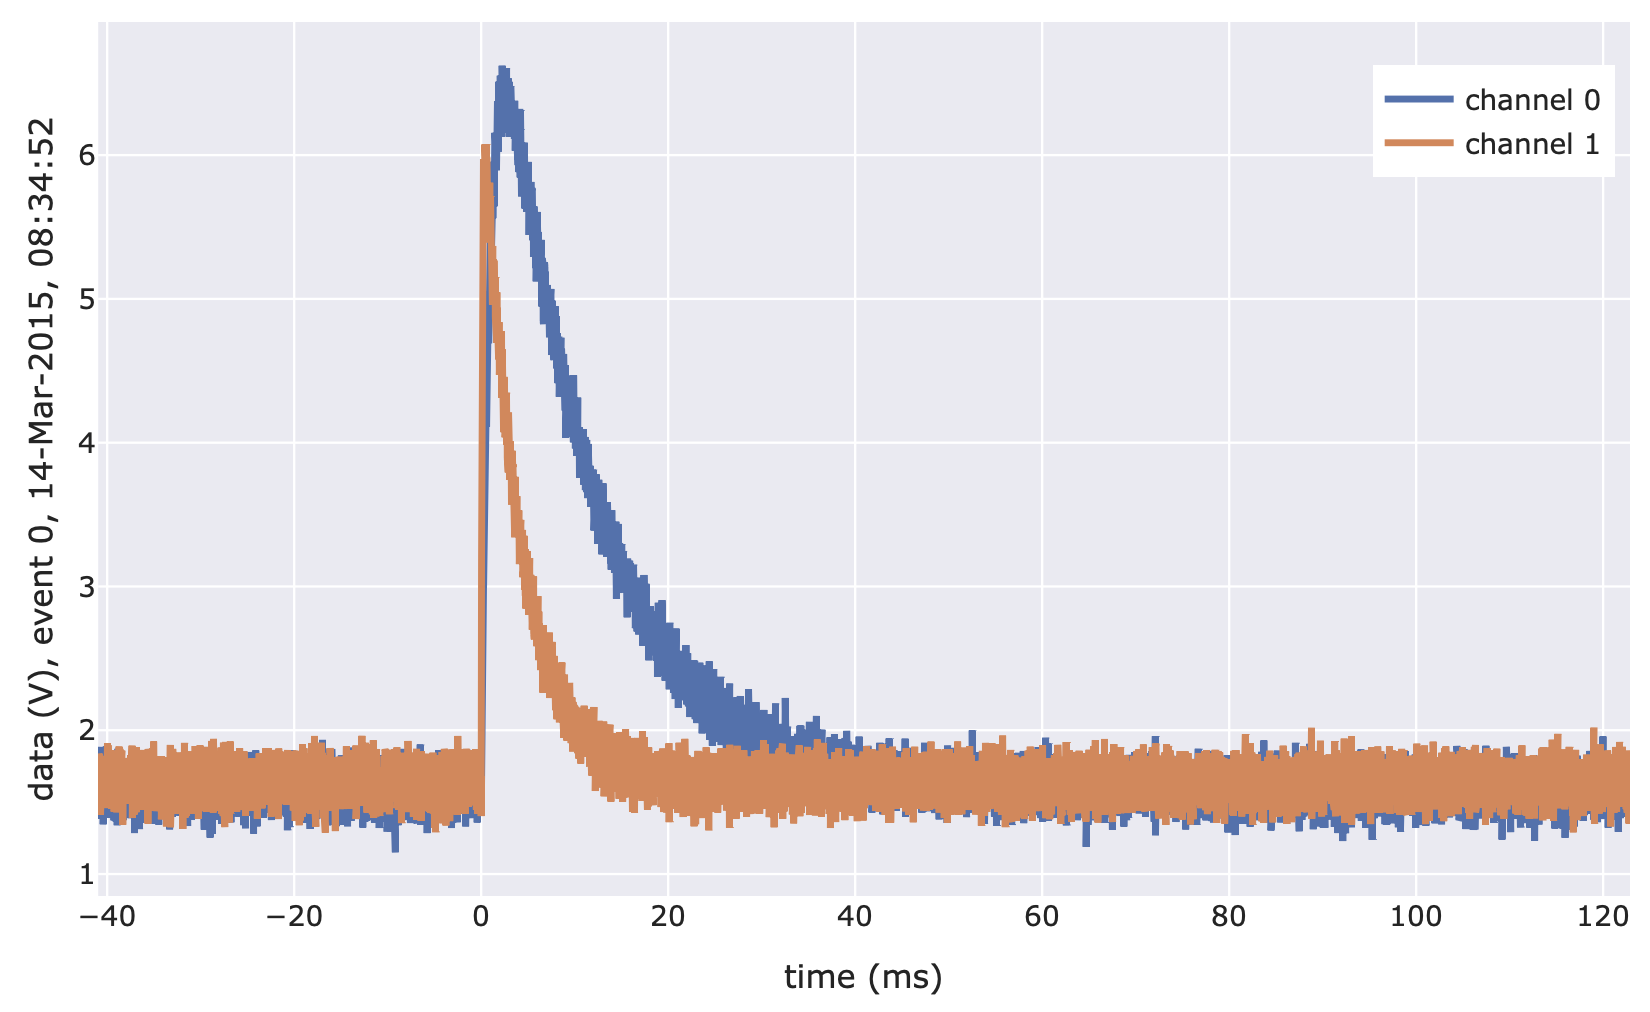
# view event traces of an iterator
vai.Preview(without_bl)
- functions (docs)
Functions can be applied to events or event iterators and range from straight-forward ones like
RemoveBaseline(which removes the baselines from given events) to more complex ones likeOptimumFiltering. The functions ofcait.versatileare implemented as classes and they can be called like regular functions after construction. The idea behind this is that you specify the parameters of a function at the time of instantiation (e.g. you provide the optimum filter to be used toOptimumFilteringor the baseline model toRemoveBaseline). After that, the function is just repeatedly called with events for which it should be evaluated.cait.versatileprovides a routine (apply) which applies a function to an event iterator with built-in options for multi-threading and processing events in batches.Functions also expose a
.preview()method which can be used to interactively investigate the effects a function has on events. See below.Example:
it = vai.MockData().get_event_iterator().with_processing(vai.RemoveBaseline())

f = vai.MainParameters(dt_us=it.dt_us)
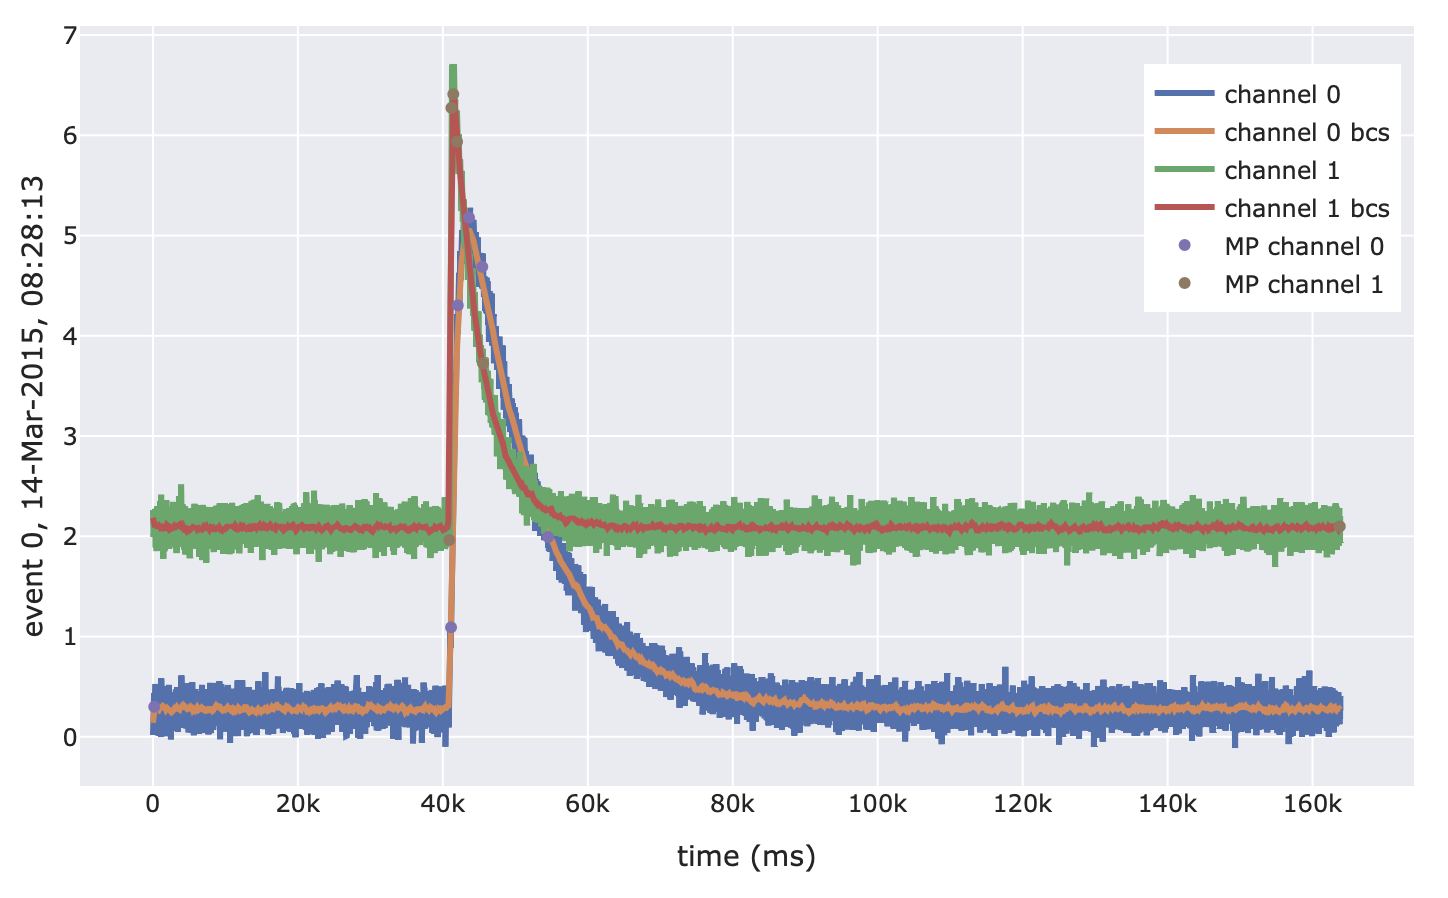
# Check the effect the MainParameters function has on the events of the first channel
# (it plots the event, the moving average that is applied, as well
# as the points selected to infer time constants and pulse height)
vai.Preview(it, f)

# Calculate main parameters by applying MainParameters to the iterator
mp = vai.apply(f, events)

# Generate a directory where the keys correspond to the names
# of the main parameters and the values to the calculated values
mp_dict = {k: v for k, v in zip(f.names, mp)}
- analysis objects (docs)
Central parts of almost all analyses are the standard event (SEV), the noise power spectrum (NPS) and the optimum filter (OF), which is why we provide dedicated objects
SEV,NPS, andOFto easily use, view and share them. All three objects have classmethodsfrom_dhandfrom_filewhich let you read them from aDataHandleror xy-file. The reverse methodsto_dhandto_filealso exist. Furthermore, all three have a methodshowwhich plots the object.SEVandNPScan also be created from event iterators (e.g. after creating a clean subset of noise traces, you could just hand the iterator toNPSwhich will build the noise power spectrum for you).Example:
it = vai.MockData().get_event_iterator().with_processing(vai.RemoveBaseline())

# Create standard event from events in iterator
# (usually, you would clean it first)
sev = vai.SEV(it)

# Plot the standard event
sev.show()
- plotting (docs)
Often needed plotting tasks are simplified by classes like
Line,ScatterandHistogramwhich make having a quick look at your data simple. More sophisticated classes includeStreamViewer, which lets you interactively view the contents of the data sourceStream, andPreview, which shows a preview of the application of a function to an event iterator. Alternatively, the latter can just be used to view the events in an iterator.The plotting classes are built upon different backends and you can choose the backend using the
backendkeyword argument when creating a plot. This lets you, e.g., get an interactiveplotlygraph at first, which you can then switch to amatplotlibgraph for your presentations easily.
Detailed Documentation